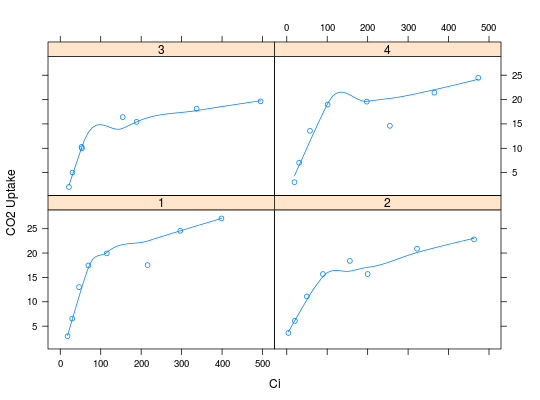
plot A/Ci curve
Usage
plotAC(data, fittd, id.col = 1, trt.col = 2, ylab = "CO2 Uptake", xlab = "Ci", by = c("trt", "ID"), type = c("p", "smooth"))
Arguments
- data
- Input data in the format needed for the
mOpc4photo; assumed to have the following structure col 1: trt col 2 (optional): other treatment factor col 2: Assimilation col 3: Quantum flux col 4: Temperature col 5: Relative humidity col 6: Intercellular CO2 col 7: Reference CO2 - fittd
- Optional fitted values.
- id.col
- Specify which column has the ids. Default is col 1.
- trt.col
- Specify which column has the treatments. Default is col 2. If no treatment is specified then use 1.
- ylab
- Label for the y-axis.
- xlab
- Label for the x-axis.
- by
- Whether to plot by id or by treatment.
- type
- this argument is passed to the
xyplot. It changes the plotting symbols behavior.
Value
-
NULL, creates plot
Description
Function to plot A/Ci curves
Details
A small helper function that can be used to easily plot multiple A/Ci curves
Examples
data(aci)
plotAC(aci, trt.col=1)